Behavioural data for policy makers
Institute of Global Health Innovation
International research and strategy
The Institute of Global Health Innovation and YouGov collaborated to gather global insights on behaviours and life satisfaction during COVID-19.
Through weekly surveys of up to 30,000 people across 29 countries, they tracked changes in compliance with preventative behaviours, revealing the complex relationship between public policy and behaviour and its impact on the virus's spread.
This valuable resource helps policy analysts respond effectively to the pandemic by communicating relevant data quickly.
Role:
Design Strategist
Responsibilities:
design, information architecture, planning and facilitating research sessions with Academics, Policy Fellows, Chief Scientific Advisors, Healthcare Providers, Members of the WHO and HIMISS.
Team:
Design Strategist (me)
Strategy Lead
Product Manager
Product Designer x 2
Technologist
Approach
Rapid orientation
We didn’t have much time, so we searched for areas where we could create the most value in the quickest way possible. We looked at the potential users, the data, the technology available and the design. What was the best way to tell the story and make it accessible and actionable? It was vital to give insight and evidence - not instruction on policy. We started by interviewing a range of experts from key global healthcare and policy organisations.
IMMERSION
The route to impact
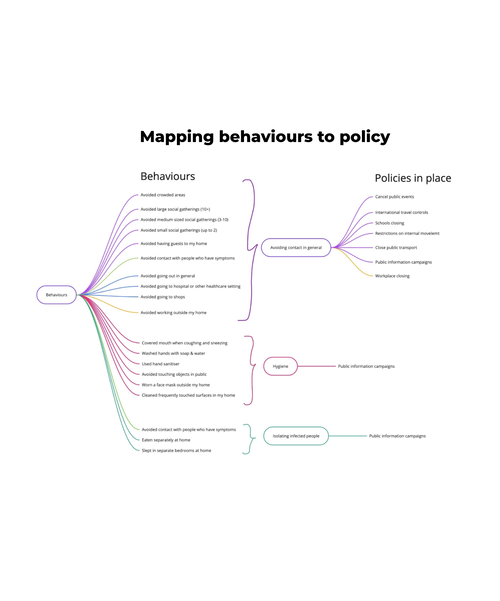
Our research insights showed that IGHI could make the most impact by targeting influential analysts working directly with government and health policy makers in 30 countries - and by giving those time-poor analysts high level headlines and visual evidence on how a population was behaving.
PRIORITISAION
Testing concepts with users
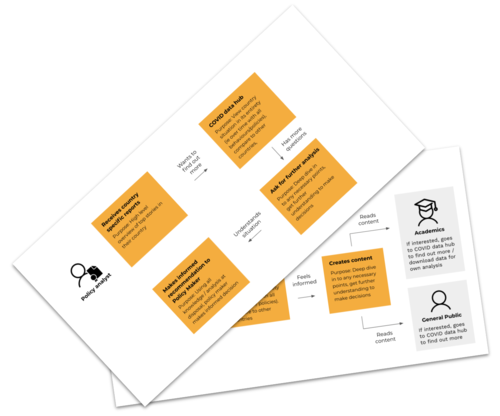
We created two types of insight report: one country specific; one giving global insights. The focus was on improving the process: How can the reports be created and distributed with minimal manual work for the team? We examined the content: What questions do the reports have to answer to meet the needs of users? And we explored design options: How can we deliver the right content in a way that fits with process needs and creates the right impact with users?
PROTOTYPING & TESTING
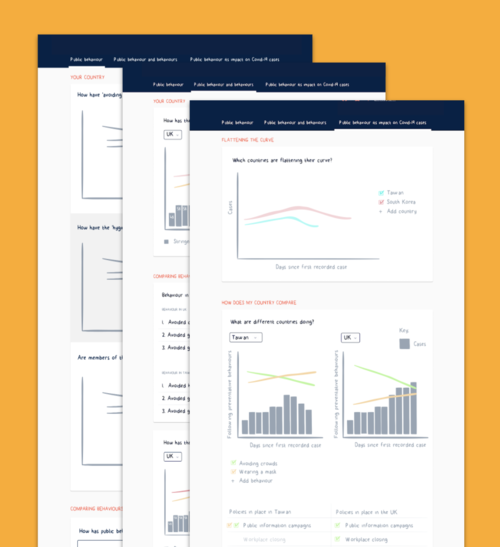

Insights > Data
The result was a streamlined insight generation process: a template design to be re-generated each week, integrated with the team’s existing data visualisation tools to enable even quicker report creation. In just 4 weeks, IGHI has found a way to bring this unique and valuable data set to public health officials to help them in their efforts to limit the impact of COVID-19.
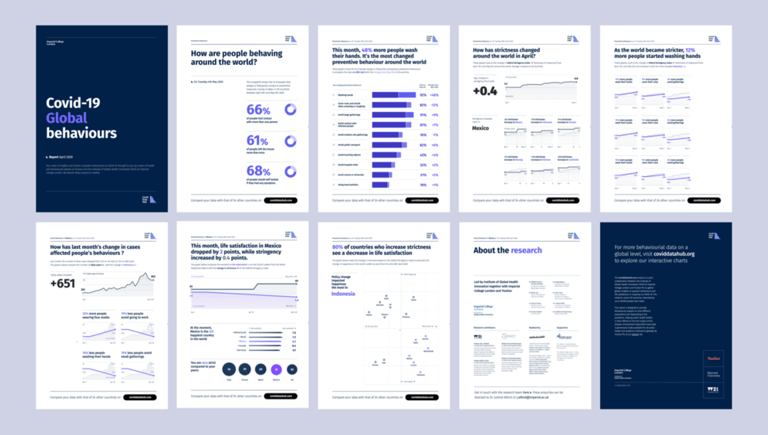
THE OUTCOME
Impact
"I love the report formats, they are very clear, it is the quick type of info people are looking for.
I really like the way you designed the graphs. I cannot believe you accomplished this in this amount of time. I am completely stunned."
Sarah P. Jones, IGHI


A focus on the ‘influential’ users and their needs
A lightweight, repeatable process for delivering regular insights.
A report structure that answers the key user questions
An integrated solution that works with existing data visualisation tools already used by the team.
A growing, engaged audience of report readers.
A framework for integrating new insights and iterations as the data and user needs evolve.